Enterprise Intelligence
Enterprise Intelligence solutions that turn your scattered data, documents and systems into answers your leaders can act on.
Executives, operations, finance and risk teams lose time chasing numbers that live in different systems and rarely agree. AppXcess connects those sources into one trusted view, adds analytics and AI on top, and delivers the insight and recommendations behind each decision — with the reasoning visible.
What Enterprise Intelligence Does
One connected view of your enterprise data, and the analytics and AI that turn it into decisions.
It works in five steps. Your enterprise data is connected from the systems that already hold it. That data is organised into shared knowledge, so the same customer, product or cost means the same thing everywhere. Analytics and AI then look for what matters, explain what is happening and recommend what to do next — leaving the decision, and the accountability, with your people.

Operational Intelligence
The problem: operational issues surface after they have already cost you time or money.
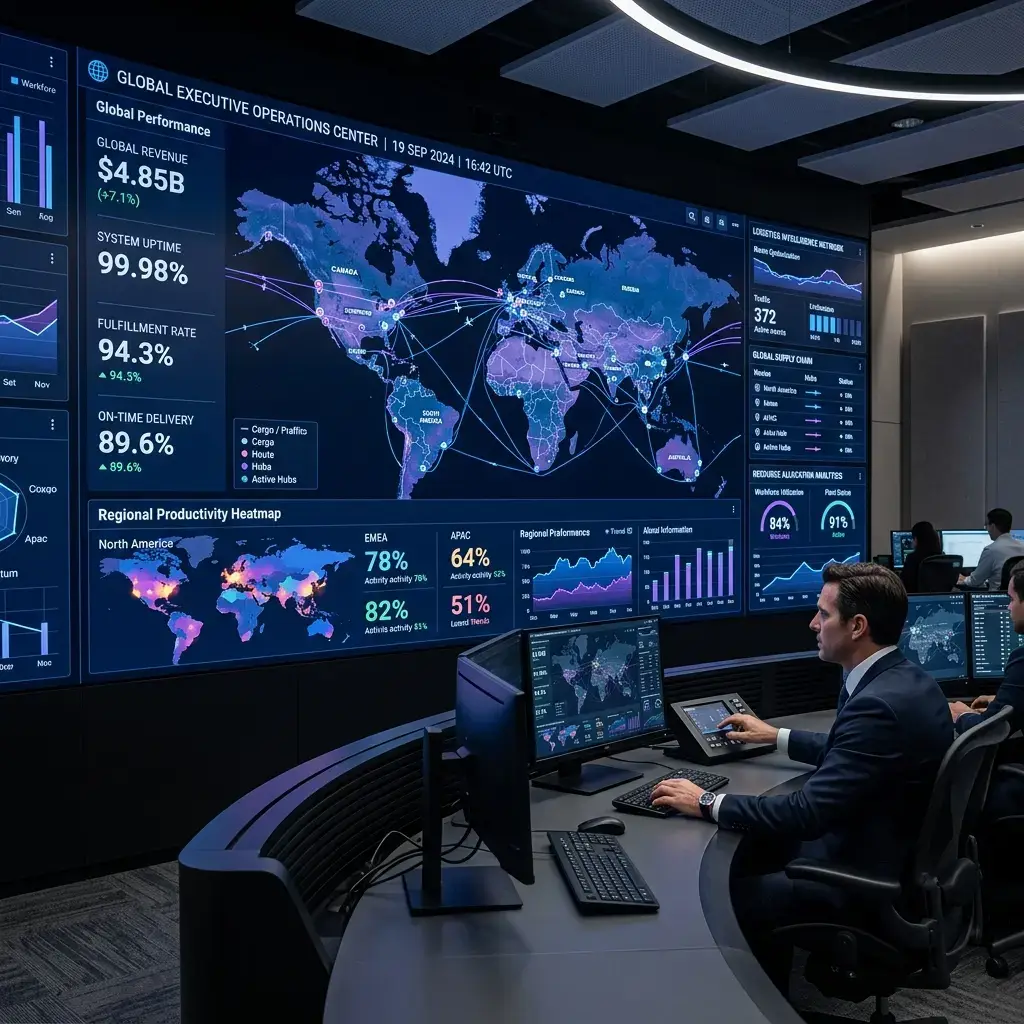
Operational intelligence watches the live signals from distribution routes, logistics schedules, production runs and sales workflows in one place. Teams see delays and bottlenecks as they form rather than in next week's report, and the people who can act are alerted while there is still time to act. The outcome is better operational visibility and fewer surprises.

Executive Decision Intelligence
The problem: big decisions get made on stale numbers and competing versions of the truth.
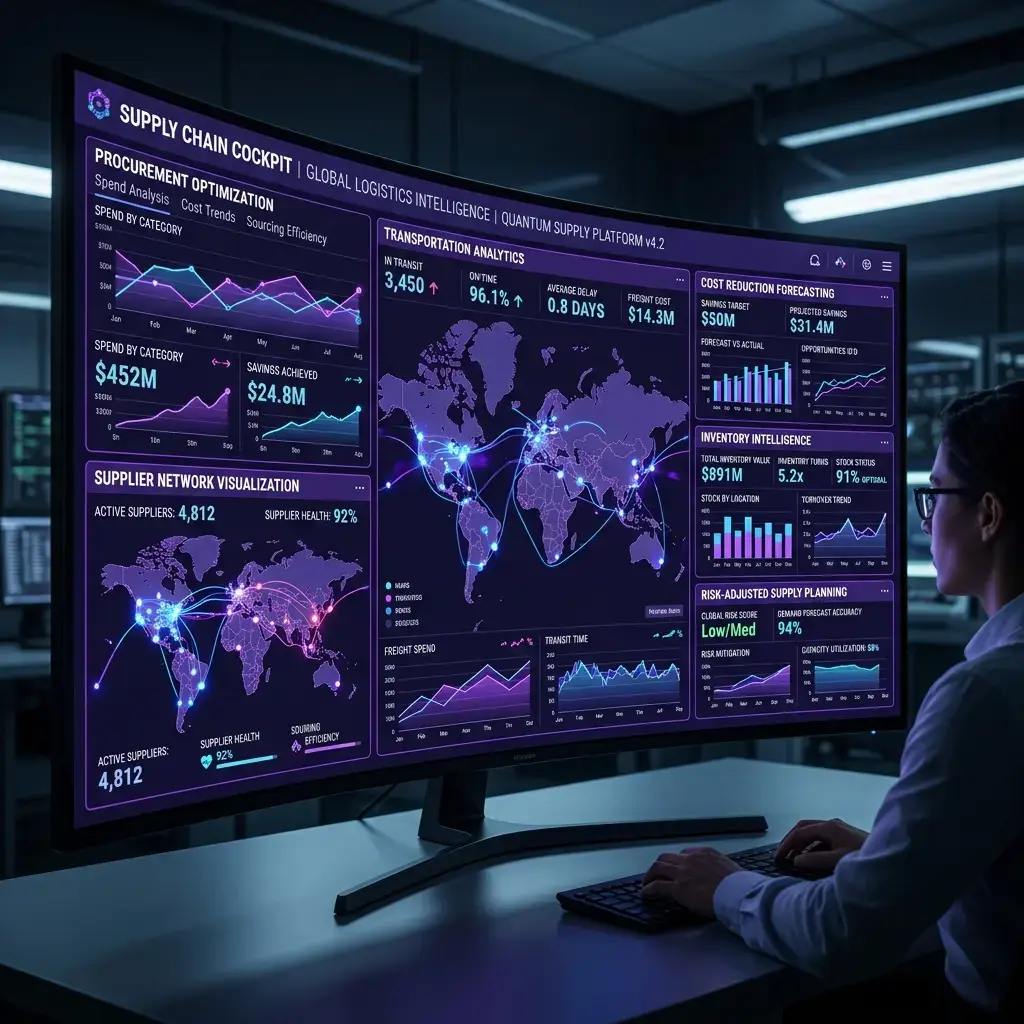
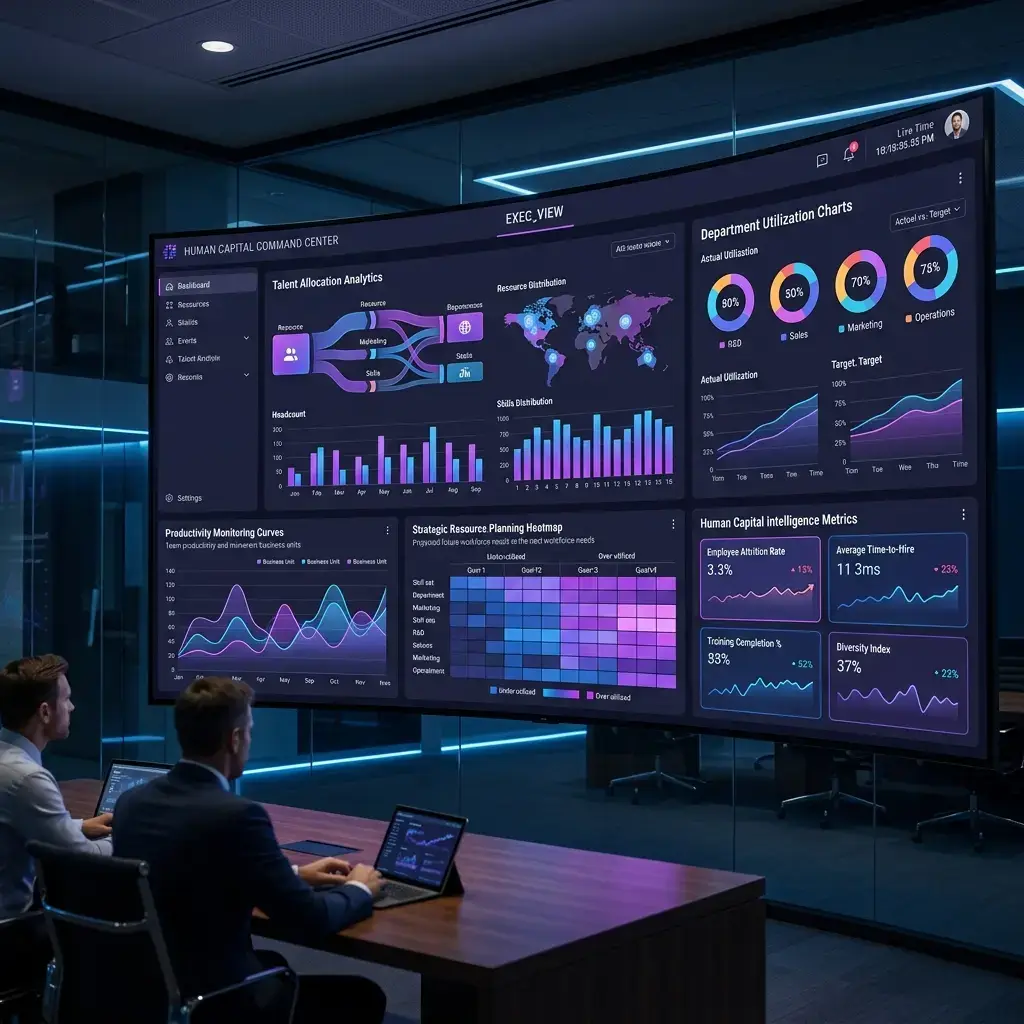
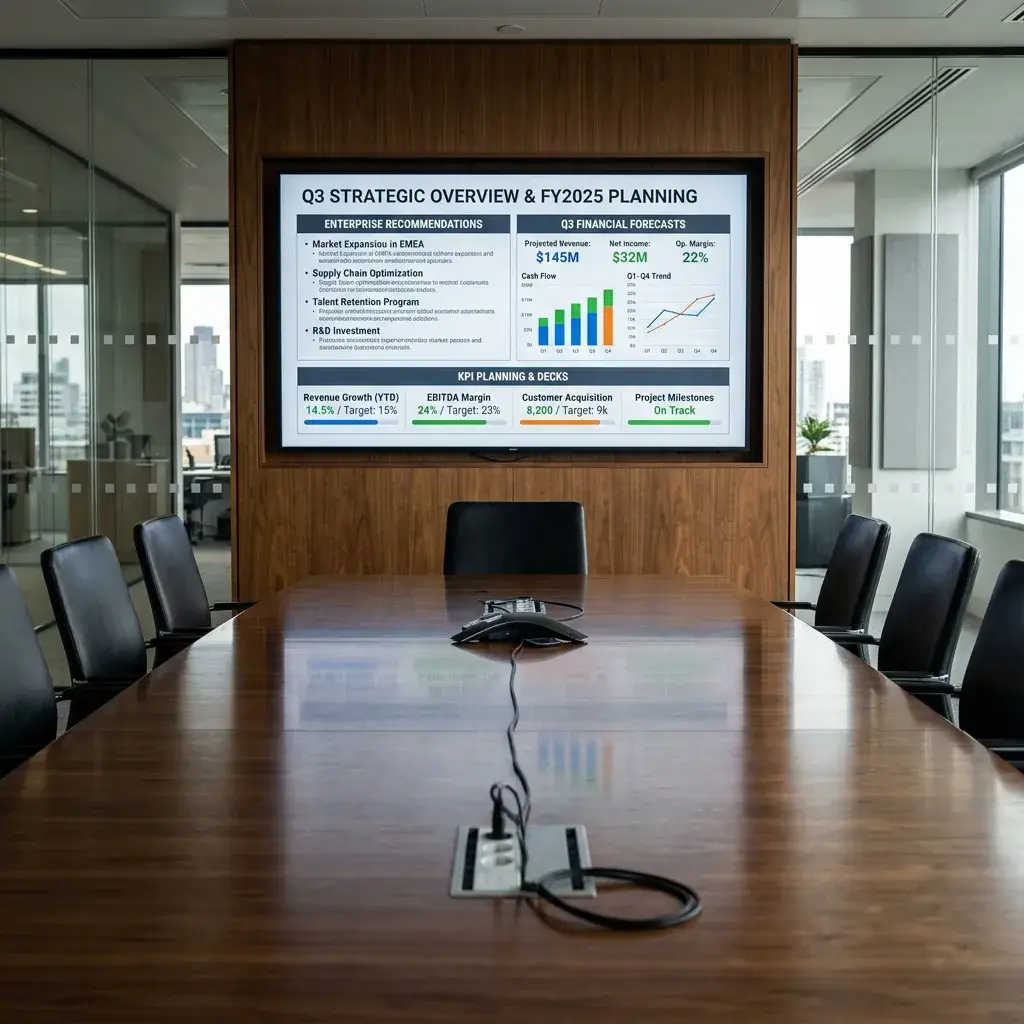
Executive dashboards bring the measures your leadership team actually steers by into one view, then let you test a change before you commit to it: adjust a shift pattern, a resource cap or a supply route and see what it does to the rest of the business. The example below shows how a scenario view behaves — the figures shown are placeholders, and a live deck runs on your own data.

Enterprise Knowledge Discovery
The problem: the answer already exists somewhere, and nobody can find it.
Knowledge discovery connects your documents, policies, databases and system logs so a question can be answered in one place, with the source shown. A new joiner finds the current policy instead of an outdated copy, and a support specialist finds the previous case rather than starting again. The outcome is less time searching and fewer information silos.
Predictive Analytics and Scenario Planning
The problem: choices are compared on opinion because no one can model the alternatives.
Predictive analytics uses your history, your business rules and AI models to show the likely outcome of each option: what demand looks like next quarter, where margin is at risk, what a capital decision does to capacity. Leaders compare pathways side by side, with the assumptions written down, before money is committed.

Risk Analysis
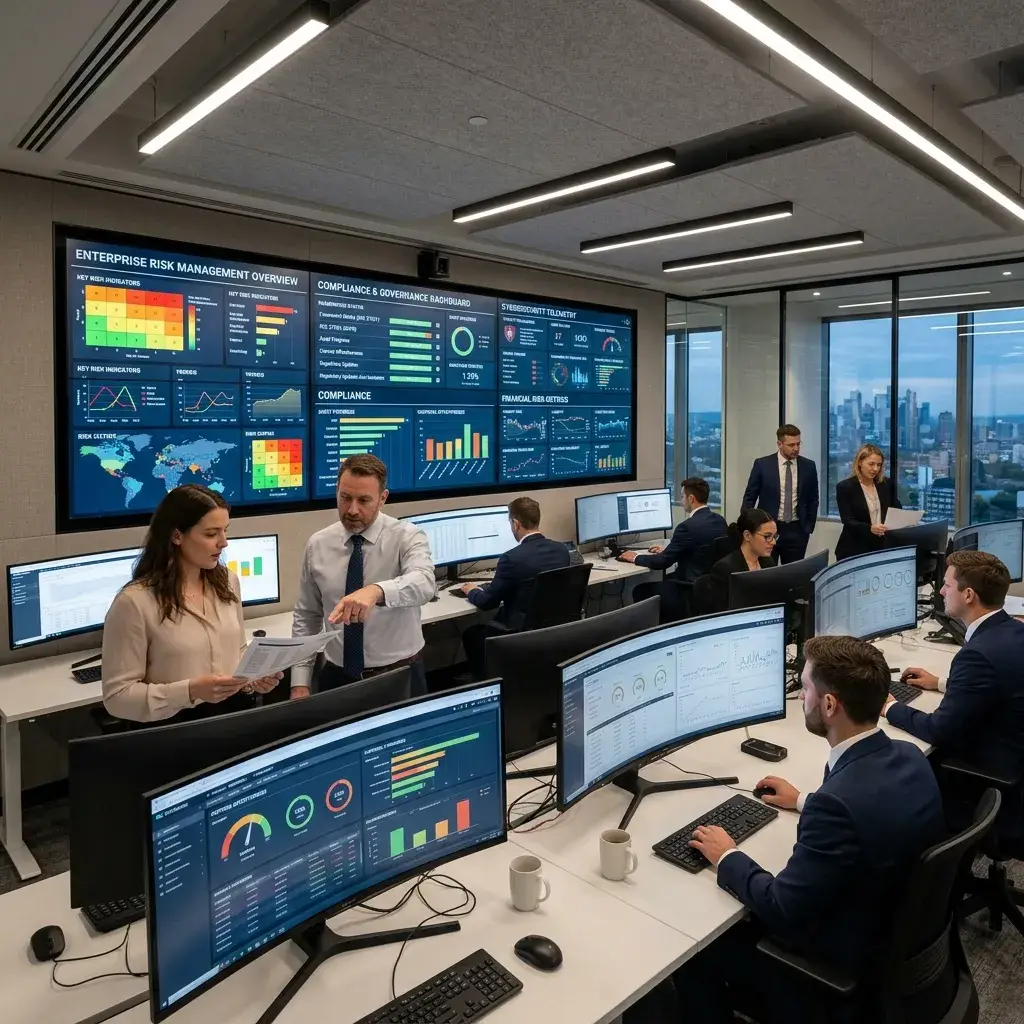
The problem: exposure is discovered in the monthly review, not when it appears.
Risk analysis watches market movements, currency positions, supplier contracts and regulatory changes against the thresholds your business sets. When exposure builds, the responsible team is alerted with the detail behind it, so mitigation is a decision someone makes early rather than a reaction after the fact.
Financial Visibility
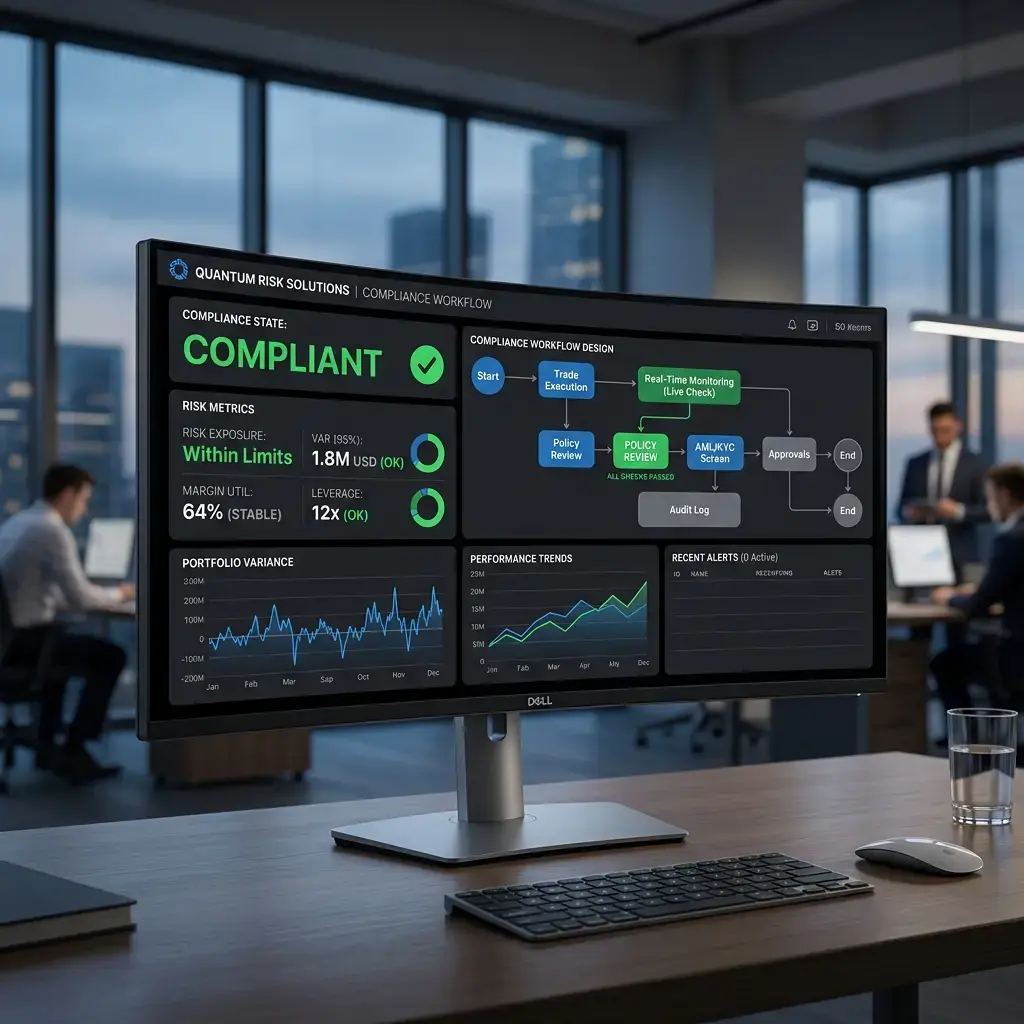
The problem: finance reports where the money went, long after it went there.
Margin Optimization
Financial visibility brings ledger entries, billing, supplier invoices and departmental spend into one current view, so profitability is something finance can watch rather than reconstruct. Leakage and duplicate spend surface while the period is still open, and budget owners see their position without waiting for the pack.

Cross-Department Insights
The problem: each department measures its own work, so nobody sees the whole chain.
When production, workforce and logistics data sit in the same view, a delay can be traced to its cause rather than argued between teams. Capacity is balanced against real demand, and the trade-off one department makes is visible to the others it affects — which is usually where the recoverable time is.
From Enterprise Data to Business Decisions
Enterprise intelligence is one chain, not a set of separate tools. Each stage below has a job, a practical example and the value it adds — and the chain ends with a person making a better-informed decision.


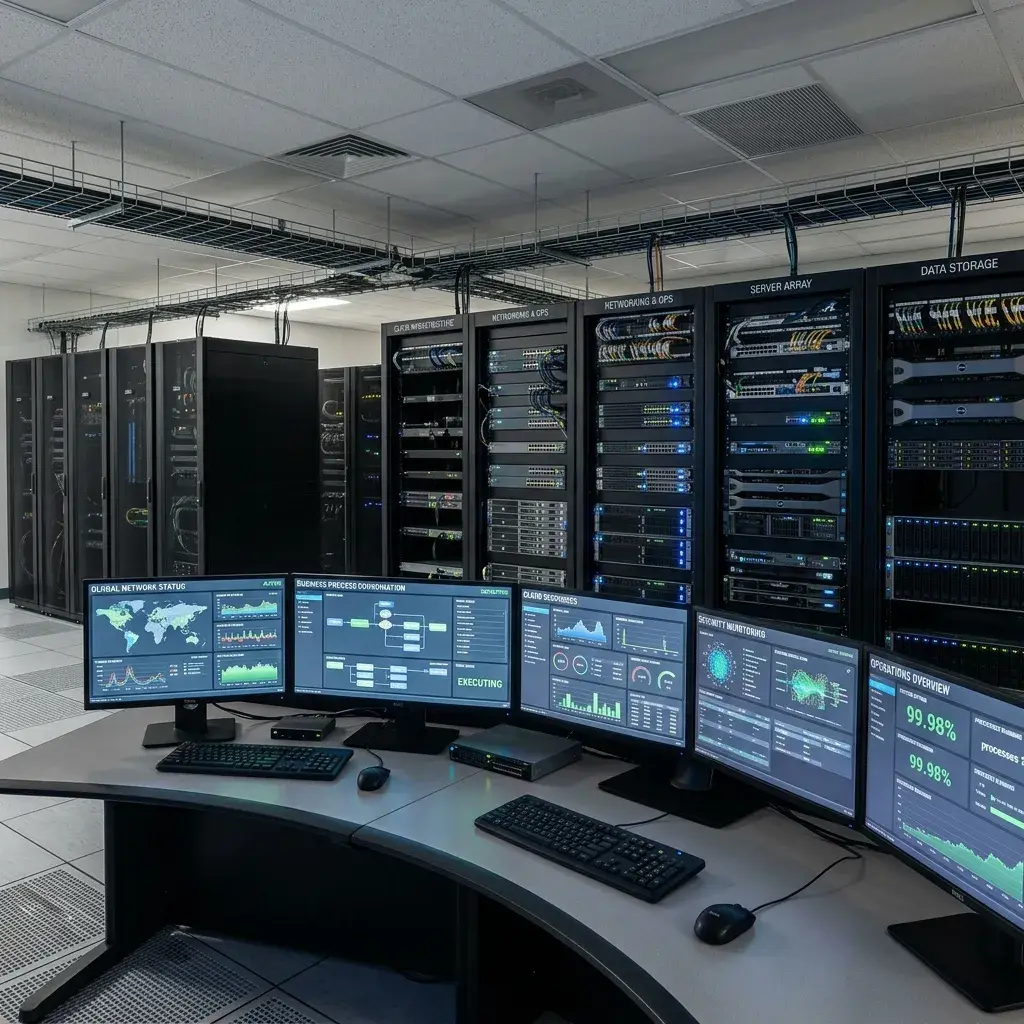
Connected to Your Enterprise Systems
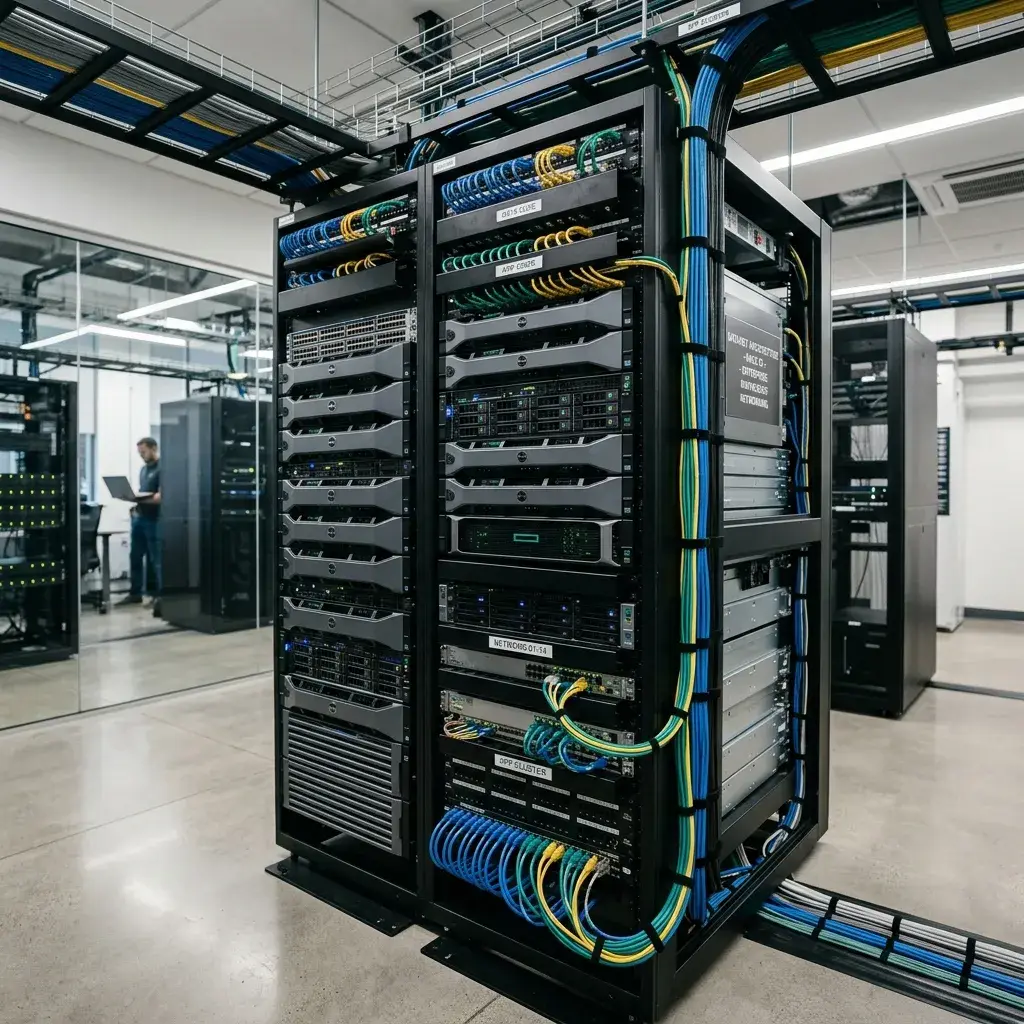
Enterprise intelligence reads from the systems you already run — databases, CRM, ERP, document stores and other business applications — under the access rules your IT and security teams set.
Your Systems
Databases, CRM, ERP and documents.
Security
Your existing security controls apply.
Controlled Access
People see what their role permits.
Governance
Sources and changes stay reviewable.

Enterprise Benefits and Business Value

Acceleration of Strategic Planning
Assembling the numbers by hand delayed every decision that depended on them.
Put the forecast, the assumptions behind it and the recommended options in front of the leadership team in one view.
Planning cycles shortened, because the forecast is compiled from live data instead of assembled by hand.

Unification of Data Silos
Data sat in separate systems, so no one could see the whole picture.
Connected the separate stores, logs and transaction records so the same entity means the same thing everywhere.
Departments work from one view of the same data instead of maintaining separate versions.

Process & Inventory Balancing
Variable logistics rates and poor inventory flows caused production overheads.
Added live checkpoints along the process and automatic checks on supplier invoices.
Throughput is balanced against real demand, and billing errors are caught before they are paid.
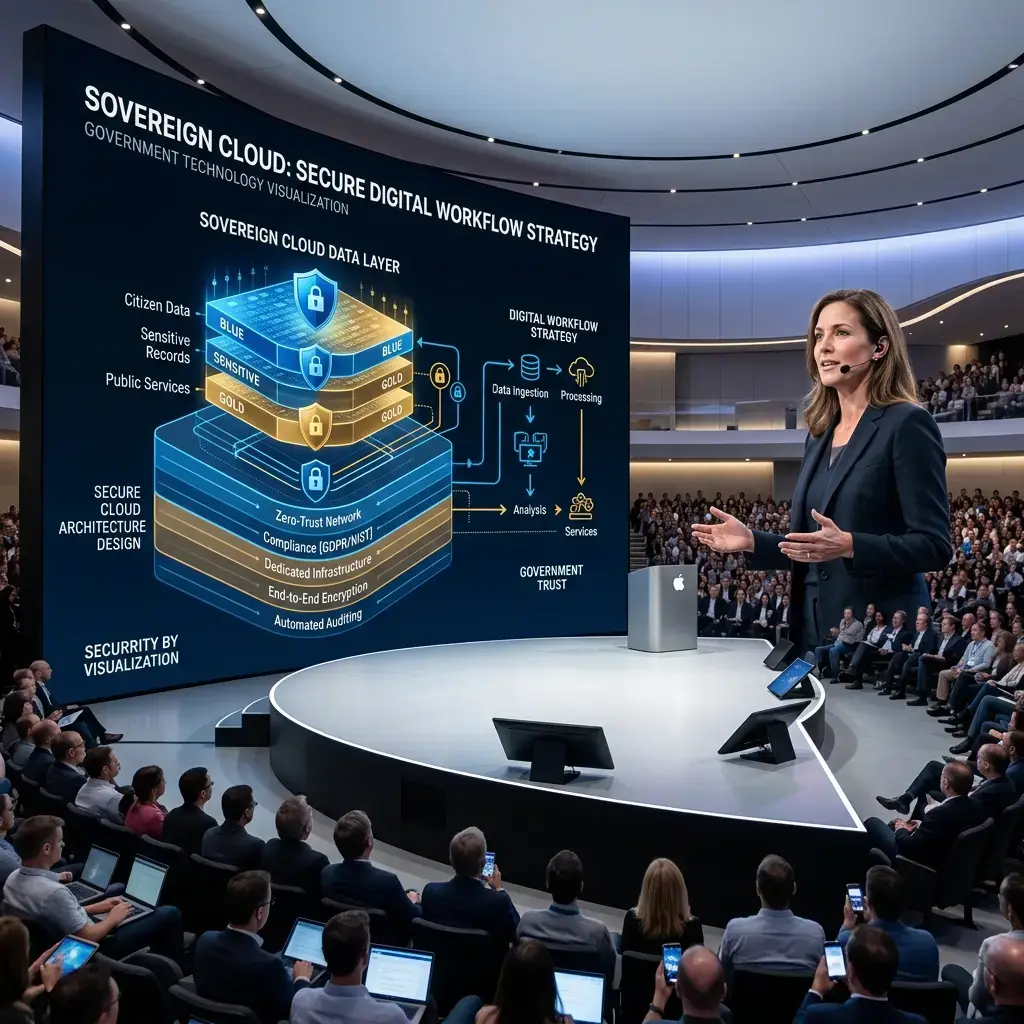
Currency & Contract Compliance
Sudden currency fluctuations degraded global supply contract margins.
Watched market and contract data against the thresholds the business set, and alerted the owner when exposure built.
Exposure is flagged as it builds, so mitigation is an early decision rather than a late reaction.
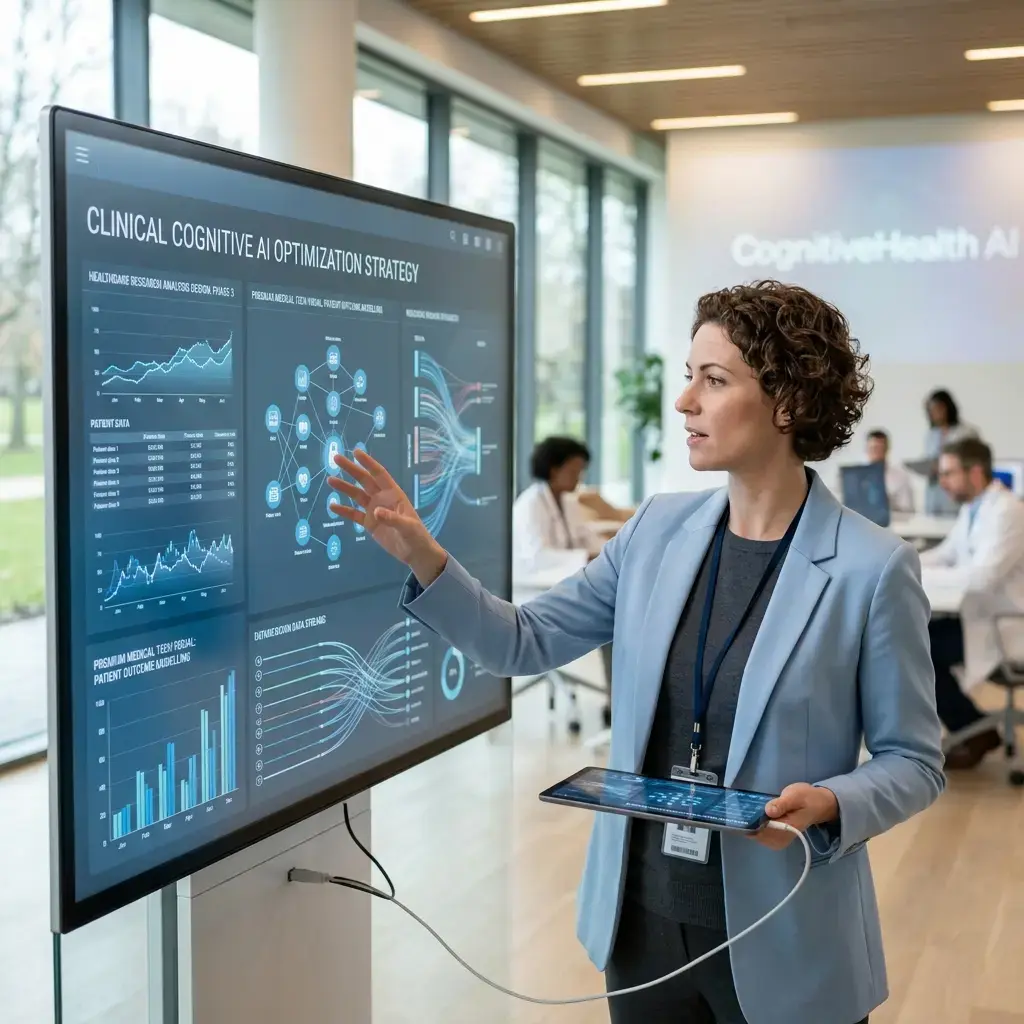
Policy & Capital Coordination
Corporate policy and capital updates delayed global department alignments.
Carried the agreed decision, and its budget and policy constraints, through to every department system.
Budgets and operational plans reflect the decision that was actually made, in every department.
Enterprise Intelligence FAQs
Enterprise intelligence connects the data your business already holds — in ERP, CRM, databases and documents — organises it into shared business knowledge, and applies analytics and AI so leaders get insight and recommendations instead of raw reports. The decision stays with your people; the work of assembling the evidence does not.
Traditional business intelligence reports what happened. Enterprise intelligence adds the layers either side of that: a shared knowledge layer so the numbers agree across systems, and analytics and AI that explain why something is happening and recommend what to do next. Existing dashboards usually remain, fed by the same connected data.
Databases, CRM, ERP, document stores and other business applications, through the interfaces those systems provide. The aim is to read from the systems you already run rather than to replace them.
Executives steering the business, operations teams watching live performance, finance teams tracking spend and profitability, and risk teams monitoring exposure. Each gets a view suited to their role, drawn from the same connected data.
Data stays within the controls your security team already applies, people see what their role permits, and the sources, models and changes behind a recommendation are documented so results can be reviewed and explained.
We usually start with one decision that is slow or contested today, map the data it depends on, and agree how you will measure the improvement against your own baseline. That keeps the first phase small and makes the value visible before scope grows.
Build Your Enterprise Intelligence Strategy
Tell us which decision is slowest or most contested in your business today. We will map the data it depends on, show what a connected view would change, and agree how you would measure the difference against your own baseline.